choose a skill cluster

skills & motivations
This section provides a breakdown of the inherent skills, learned skills and motivations/aspirations for each skill cluster. Inherent skills and motivations/aspirations combined are commonly defined as “soft skills” in the market.
inherent skills
- 1. analytical and problem-solving
- 2. detail-oriented, focusing on accuracy and timeliness
- 3. communication and presentation
- 4. independent working while collaborating with a team
learned skills
- 1. accounting systems and software
- 2. financial reporting
- 3. auditing
- 4. investment management
- 5. taxation
- 6. budgeting and forecasting
- 7. regulatory compliance
- 8. financial analysis
- 9. cost accounting
motivations/aspirations
- 1. interest in numbers and analysis
- 2. career advancement and professional growth
- 3. financial rewards and benefits
- 4. impact on business decisions
- 5. ethics and compliance
- 6. stability and job security
- 7. alignment with organizational goals
- 8. work-life balance
- 9. networking and collaboration
- 10. recognition and achievement
- 11. entrepreneurial opportunities
- 12. social responsibility and sustainability
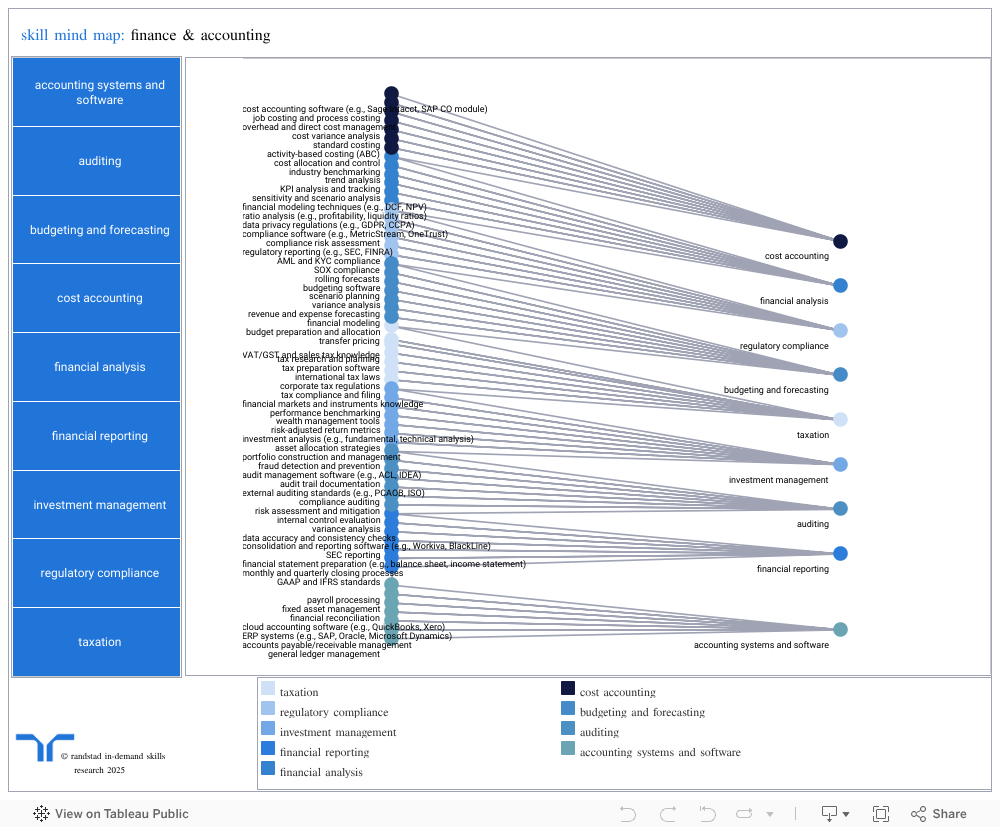
what it shows
The chart here illustrates the sub-level of learned skills required for finance and accounting in each of the 24 markets researched. The findings presented here are based on a combination of verified, normalized labor market data by market and granular, skill-based data sourced from professional social media networks and job boards, as well as career sites.
need to know
- The finance and accounting cluster requires a variety of skills tied to market-specific regulatory standards.
- Jobs in this skill cluster require at least basic knowledge of data analytics, technology and industry-specific tools.
skills supply
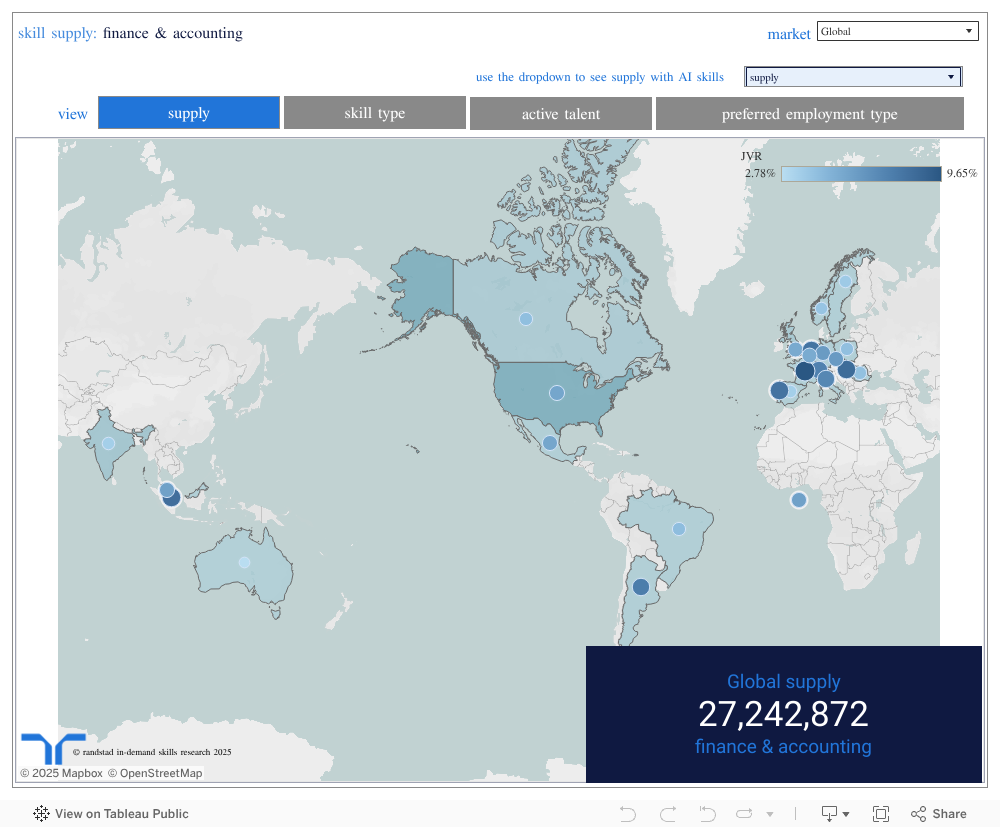
what it shows
Skills supply data indicates the total number of individuals who have the skills required for finance and accounting in each of the 24 markets researched. These figures are based on a combination of verified, normalized labor market data by market and granular, skill-based data sourced from professional social media networks and job boards, as well as career sites.
Use the chart to understand the availability of skills (“supply map”), availability of sub-skills (“skill type”), talent with recent job search activity (“active talent”), as well as the share of talent who prefer permanent or contract work (“preferred employment type”).
need to know
- The finance and accounting cluster shows one of the slowest growth rates, with only 0.7% of talent being new entrants. It is also one of just two clusters in which the majority of talent are in the experienced bracket (74.5%).
- When it comes to talent mobility, this cluster is on the lower end, with 13.4% of professionals switching jobs year over year, and 42.8% considering any changes. However, this changes significantly for talent with AI skills.
- Finance and accounting talent with AI skills are the most mobile of all groups, with 27.7% changing jobs over the last year, and 87.6% staying up-to-date on new job opportunities on the market.
skills demand
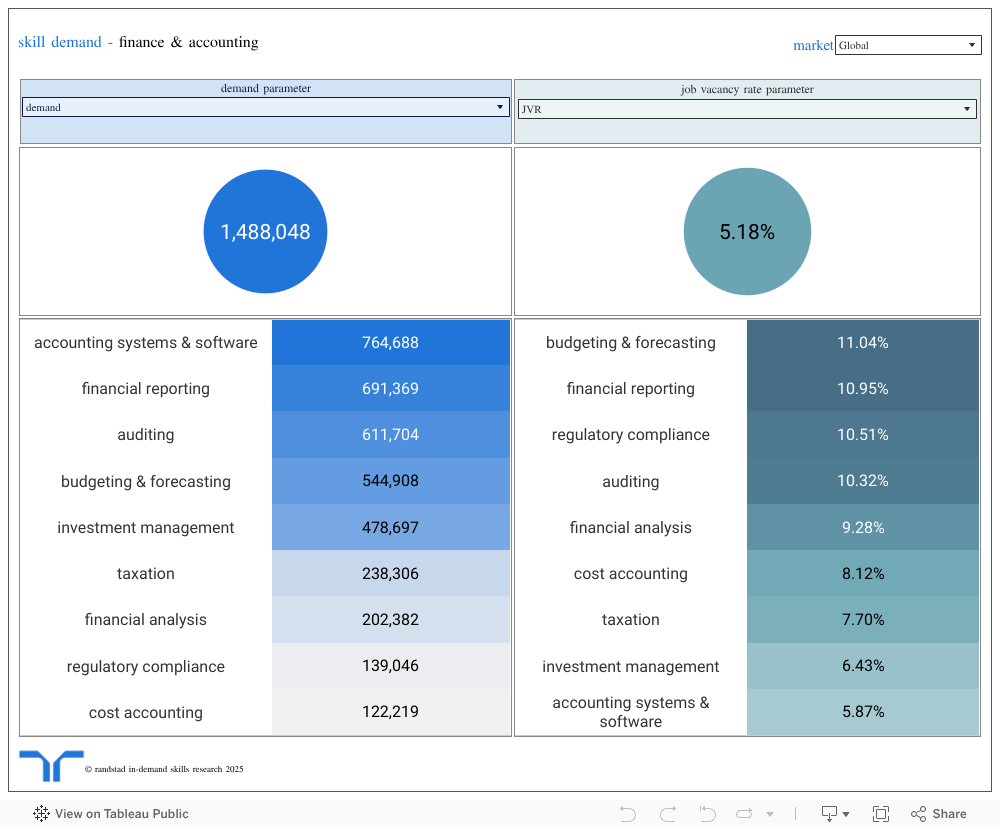
what it shows
Skills demand data indicates job postings that require finance and accounting skills in each of the 24 markets we researched. These figures are based on a combination of verified, normalized labor market data by market and granular, skill-based data sourced from professional social media networks, job boards and career sites.
See demand for each skill cluster by market, explore demand for sub-skills within each cluster or view the job vacancy ratio (JVR) — defined as hiring complexity — to understand market competitiveness for these skills. The higher the JVR, the more competitive it is to recruit. 2025 demand data takes all yearly advertisements into account.
need to know
- Job postings for the cluster have declined 12% year over year, with more than 67% of postings targeting experienced talent. This general seniority increase does not significantly raise the JVR, as the cluster is composed mainly of experienced individuals.
- Finance and accounting is the second-lowest skill cluster where employers seek AI skills; only 1.5% of job postings reference AI skills. This contrasts with how candidates approach these skills.
- France, Hungary, Singapore and Portugal show the highest local hiring complexity for this cluster, while Germany, Poland and France have the highest sub-skills hiring complexity for taxation, auditing and regulatory compliance respectively — each with a JVR above 19%.
compensation
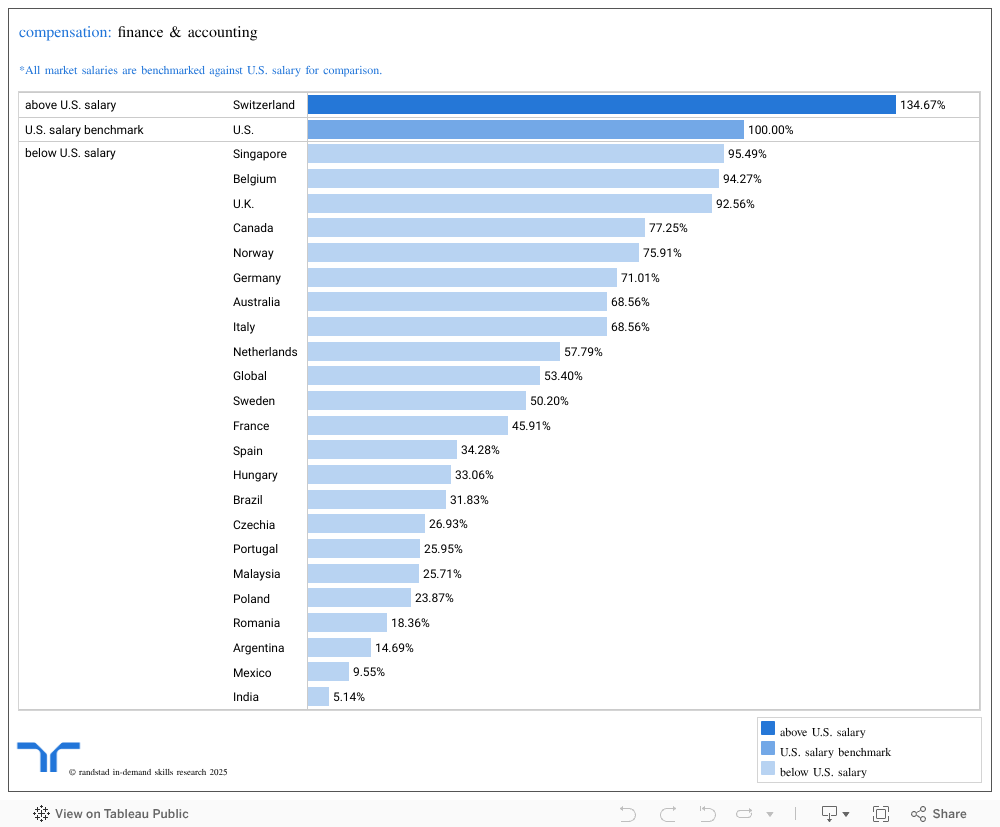
what it shows
The data included in this graph shows the average salary brackets in U.S. dollars for finance and accounting skills in the 24 markets examined by level. Compensation data is mapped and analyzed from combined sources providing current pay data.
Select the markets of interest to understand which salary ranges are considered competitive and in which markets you should recruit to stay within budget.
need to know
- Of all clusters, finance and accounting has seen the most compensation changes year over year, offering the highest compensation increases across most regions, with EMEA rising by 16.5% and the U.S. by 9.8%.
- Compensation in APAC is about 3% lower year over year, due to a general drop in demand and a concentration of junior talent. For example, Malaysia and India tend to advertise positions with lower levels of seniority.
remote & hybrid working
what it shows
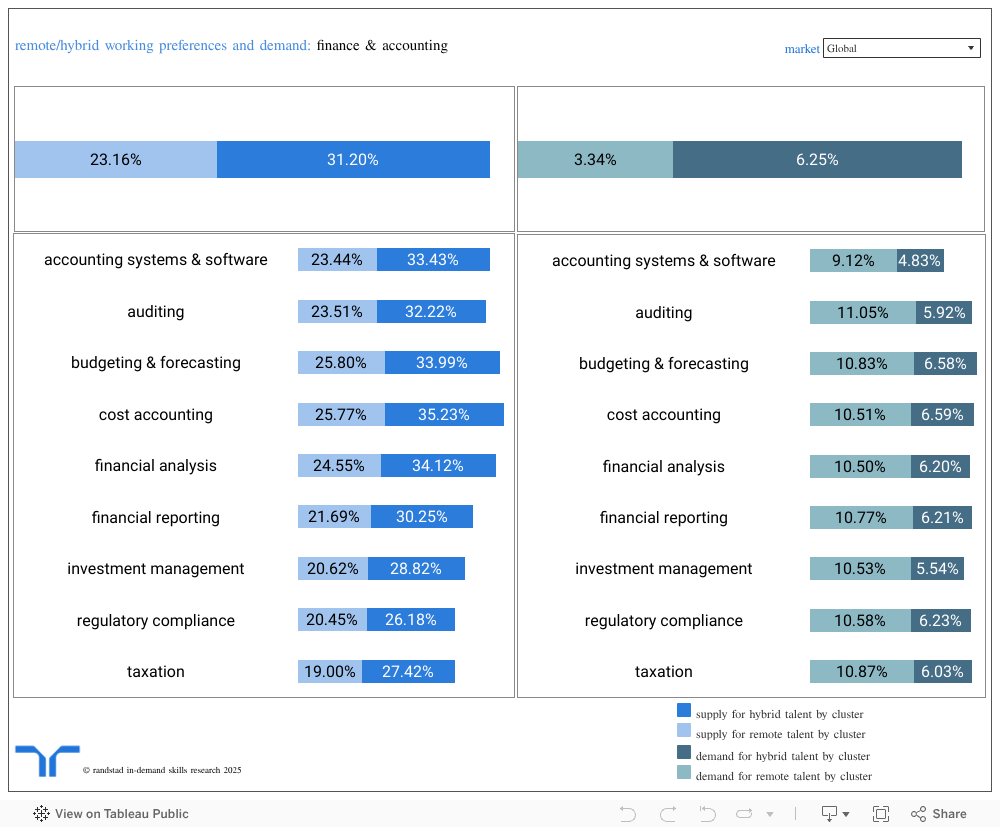
Remote working data shows the percentage of job postings that offer candidates remote or hybrid work for finance and accounting roles (noted as “demand”), as well as talent working preferences (noted as “supply”) in each of the 24 markets researched.
It is estimated that the actual share of remote/hybrid working opportunities is higher than advertised online. You can view the data by both skill cluster and individual skills.
need to know
- Year over year, the share of demand for remote and hybrid roles in this cluster have dropped by 26% and 31% respectively, with just 3.3% of job ads being remote and about 6.3% being hybrid.
- Candidate preference for such opportunities has grown year over year by 9% for remote and 14% for hybrid.
- Poland shows the most flexibility in this category, with 21.5% of job ads highlighting remote work and 43.8% with a hybrid option. Meanwhile, Italy and India are on the lower end, with just 1.5% of remote opportunities.
take a deep dive into the in-demand skills research and find your competitive talent advantage.